It is very impressive how the breakdown of screentime can show a family member’s daily routine, interest, and even personality along with the uncovering of some stories behind these data. To build a healthy relationship with technology is indeed a common task that all of us today have to overcome, especially during the time of this pandemic. I will definitely want to check out the book you’ve recommended! The report is overall very well-constructed with thorough explanations and analysis. Great work!:D
I was amazed how you visualized the statistics you had. All of the visuals were well designed, making the panel itself reader-friendly. Your analysis was very detailed and precise, too!
The shortness of your screen time surprised me; I feel that 2.5 hrs at average is very short for a college student. I’m curious if you spend more time on other devices such as an iPad or PC, or if you just don’t access to SNS and the internet that often.
 (9 ハート)
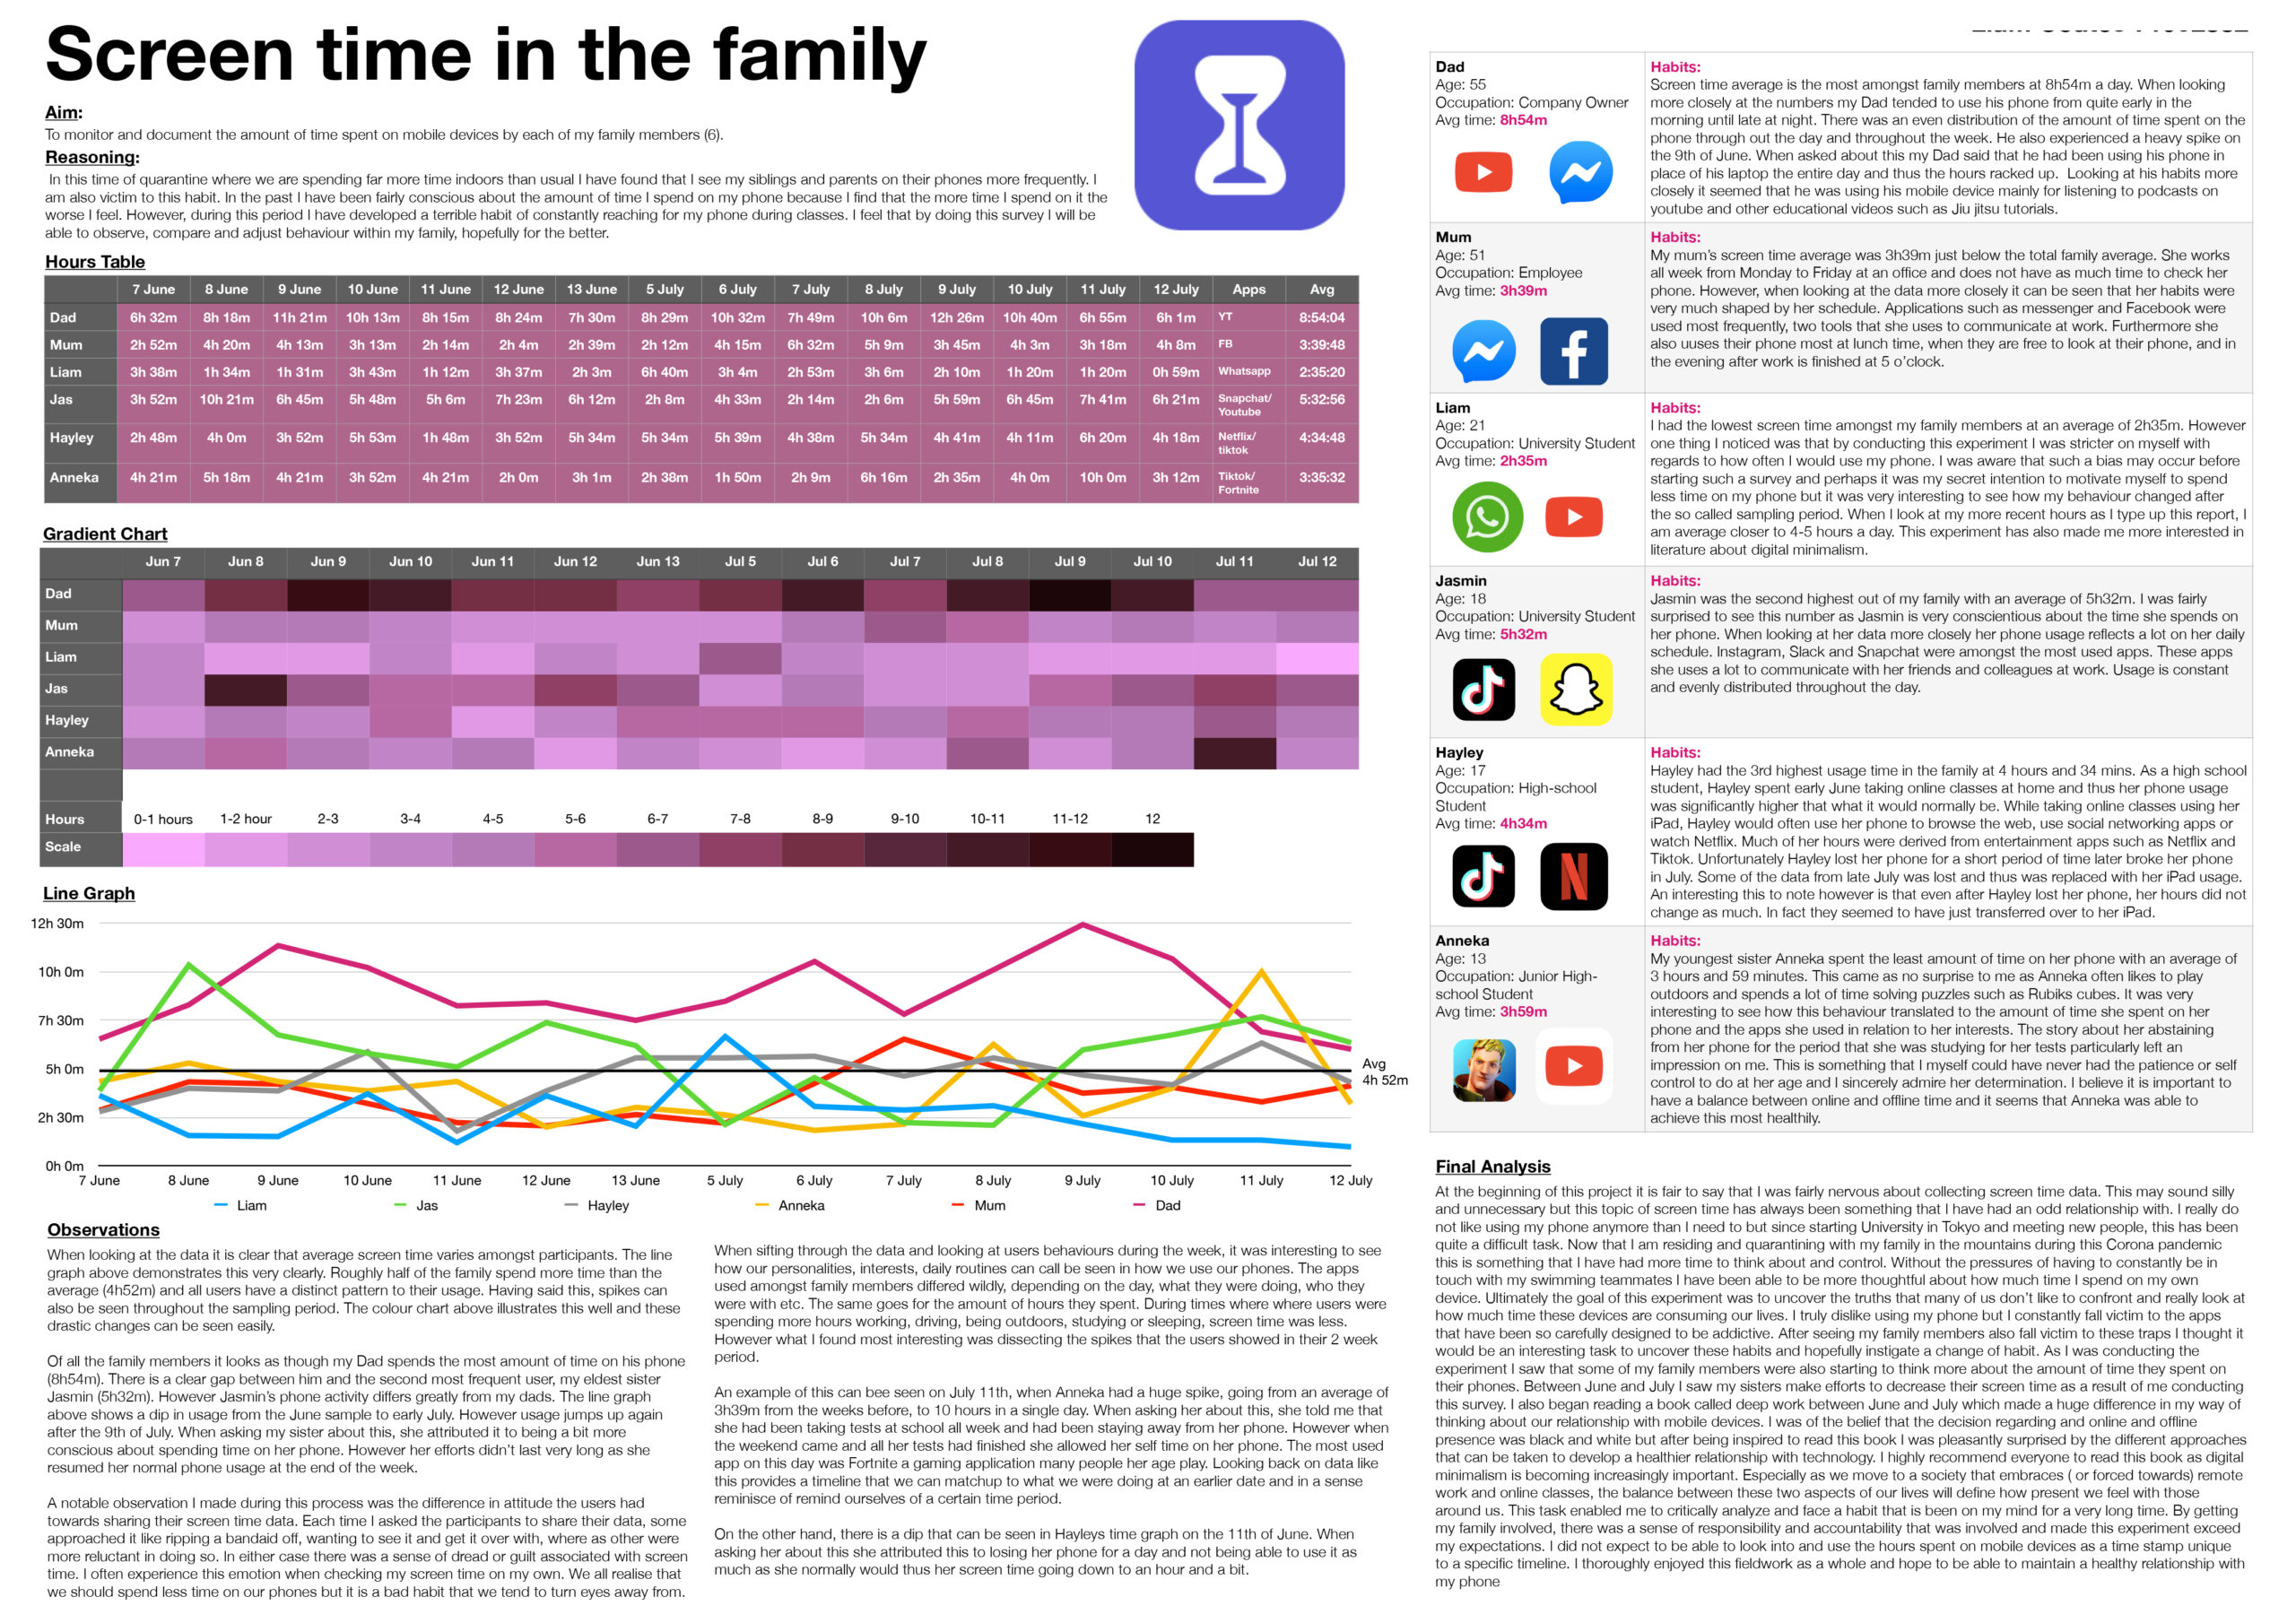
It is very impressive how the breakdown of screentime can show a family member’s daily routine, interest, and even personality along with the uncovering of some stories behind these data. To build a healthy relationship with technology is indeed a common task that all of us today have to overcome, especially during the time of this pandemic. I will definitely want to check out the book you’ve recommended! The report is overall very well-constructed with thorough explanations and analysis. Great work!:D
線グラフから読み取れる、日によって使用時間が一定じゃないのが興味深いと感じました!
年齢や性別、職業によって使うアプリはもちろんのこと、その「使用用途」も違っているんですね。
「大学生」が一番時間で少ないのは予想外でした。PCを使っているからでしょうか・・・?
I was amazed how you visualized the statistics you had. All of the visuals were well designed, making the panel itself reader-friendly. Your analysis was very detailed and precise, too!
The shortness of your screen time surprised me; I feel that 2.5 hrs at average is very short for a college student. I’m curious if you spend more time on other devices such as an iPad or PC, or if you just don’t access to SNS and the internet that often.